Before we get into explaining data analysis, it is important to know some basics about mathematics, statistics, and computer programming. Without a good understanding of these concepts, grasping the technical details of data analysis might be a bit tough.
What is Data Analysis?
Let us take a simple example. You got to the nearby bank around 1 pm to deposit some money. But, as you go out, you notice that it is quite hot outside and you could have carried an umbrella. Nevertheless, you reach the bank, only to find that the staff had gone out for lunch.
Since it was a simple task of depositing money, you had thought of having lunch after coming back from the bank. But, by the time you came back, you were quite hungry and tired! The next time you want to deposit money in the bank, you will think of the following:
- Taking an umbrella
- Going before or after the lunchtime
- Having lunch before going
So, based on your past experience and recollection of facts (data), you make a quick analysis of what would be the best time to visit the bank to deposit money! This is the essence of data analysis. Here, you feed the data to a computer, and it does the analysis for you using tools and techniques (more on that later).
Data analysis is one of the critical phases of the data science process , where data scientists and data analysts try to make sense out of the data that was collected to solve a particular problem. It is a series of steps that include (but are not limited to) one or more of data collection, organization, transformation, visualization, and analysis.
Data Science vs Data Analysis
Data analysis comes under data science, which involves both technical and business skills. However, analyzing data requires mostly technical and programming skills. When a data analyst receives the dataset, it is usually from one source, i.e., the data from various sources is integrated, and some preprocessing is done before the data analyst receives it for further processing.
Check out a detailed comparison of data science and data analysis with our data scientist vs. data analyst article.
Why Data Analysis?
Like the example above, there are many situations where we need to make ‘data-driven decisions,' i.e., decisions based on past experiences, facts, information, and so on. For example, to decide in which city you want to do college, you might want to consider where most of your friends are going.
Other important factors to consider are food, location, climate, college infrastructure, reviews about the staff, accessibility to the market, and so on. All this information is based on data collected from various sources like senior students, local people, social media platforms, and so forth over a period of time. Some decisions are complex and involve many factors, whereas others are simple. However, the human brain can analyze only a fraction of what computers can do.
Computers can collate huge amounts of data (big data) and process and analyze the same data with high accuracy. Accurate data analysis helps grow your business in the right direction by identifying potential issues ahead of time, ways to solve them and formulating better strategies.
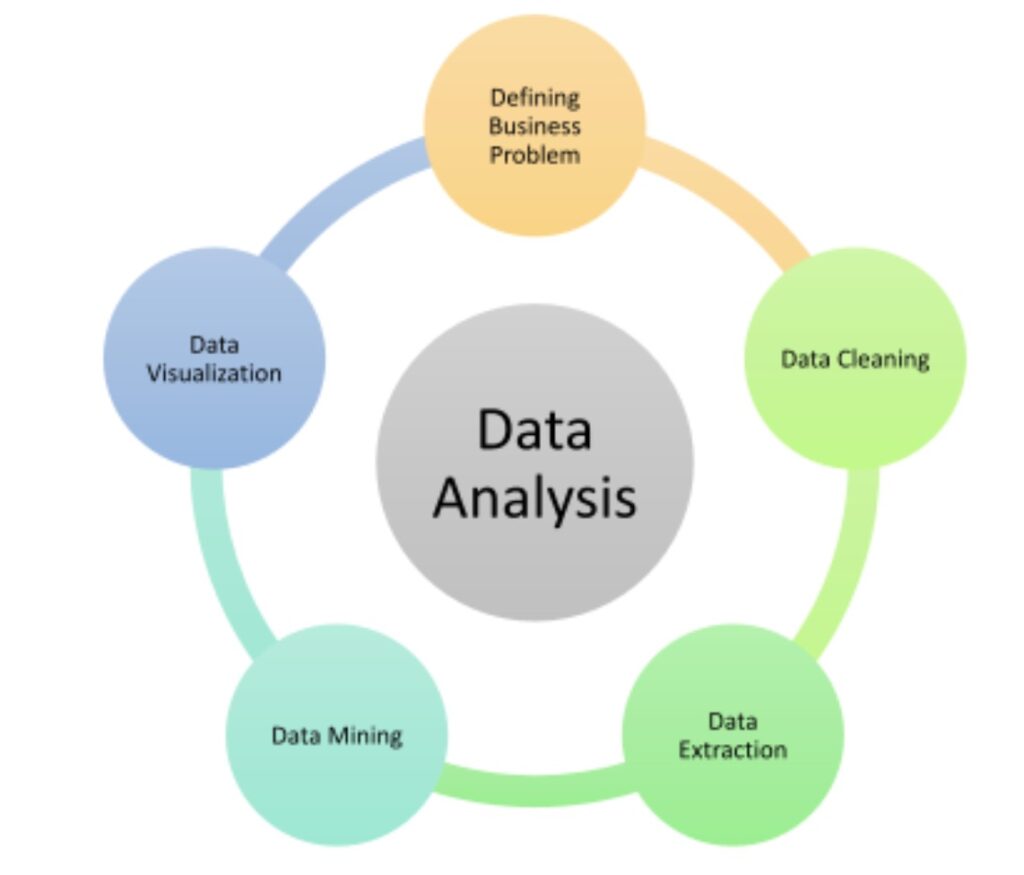
Data Analysis Phases and Process
- Defining the business problem – Identify the business problem to be solved by asking questions. Questions should be specific and clear. Through the questions, we should be able to determine potential solutions, if there are any.
- Data extraction – Collect the data around the questions asked. It should be collected, integrated, organized, and structured in a proper storage system.
- Data cleaning – The integrated data may have some incomplete values, duplicate values, irrelevant content, null values, and so on. All this has to be removed, and only relevant data needs to be kept for the next stage.
- Data mining – Here is where the data is converted into knowledge and discovery. We mine and analyze data to find important trends and patterns by applying rules and algorithms to the dataset.
- Data visualization – The insights and trends are better seen visually. Moreover, you can do so from various perspectives. By viewing various relationships and comparing the visualizations, we can quickly discover the desired useful information.
How to Perform Data Analysis? Tools and Techniques
There are plenty of tools and techniques that help data analysts perform an accurate analysis of data. From data cleaning and data exploration to data transformation and data visualization, there are many tools for each stage. Some tools are UI-based, some have the capability to perform a comprehensive analysis, some are great for big projects, and so forth.
Some of the most popular data analysis tools are R, Python, MATLAB, SAS, Spark, and Tableau. There are many techniques to analyze data, and most of the tools have rich libraries and interfaces to apply these techniques. Data analysis techniques can be classified into four categories:
- Initial and main data analysis
- Quantitative and qualitative analysis
- Mathematical and statistical analysis
- AI and ML techniques, visualization, and graphs
Types of Data Analysis
Data analysis is of 4 main types:
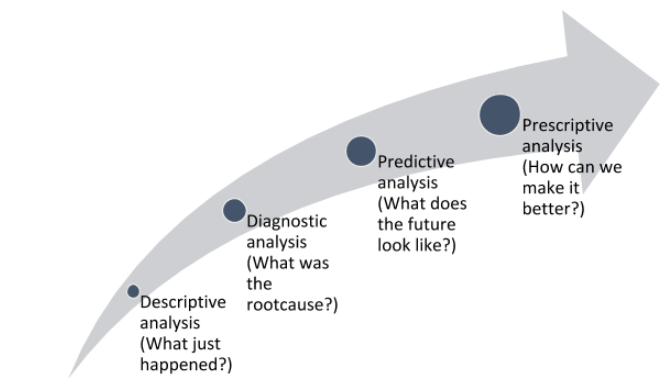
- Descriptive Analysis: In this type of analysis, we analyze past data and draw some insights. The most common analysis type is used to determine ‘what happened.’ For example, what can we do to attract more target audiences? What did we do better or worse this year? What was our revenue for the quarter?
- Diagnostic Analysis: The next type of analysis determines ‘why something happened.’ For example, why were we not able to gain new clients? Why couldn’t we retain our customers? Why did the sales of a particular product go up in a particular month? Diagnosing the root cause gives a reason why something happened.
- Predictive Analysis: We make predictions based on the information collected and the root-cause analysis. For example, sales of clothes shoot up during festival seasons and down afterward. This happens almost every year. Thus, we know that there are specific periods when the sales of clothes are at their peak.
- Prescriptive Analysis: We know what happened and why it happened and predict the general trend based on previous data and insights. The next step is to act and make decisions. What can we do to drive sales higher, even during the off-season? Let’s say give an after-festival discount (think of a clearance sale!) so that people would still come and buy clothes. Will this work out in favor of the company? This is where accurate decision-making is required!
Simple Data Analysis Using Excel
Excel is one of the most widely used and powerful tools used for the analysis of small to medium datasets. For enormous datasets, there are many other advanced tools, but Excel is an excellent way to start learning data analysis and getting hands-on experience. In this section, we will analyze a small set of data using Excel features.
So, let's start.
1. Data Collection
Excel has a tab, ‘Data,’ where there are provisions to get the data from various sources.
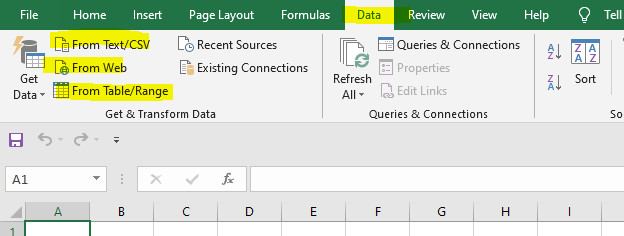
Note that you can get the data from Text/CSV files, the Web, databases, files, and so on.
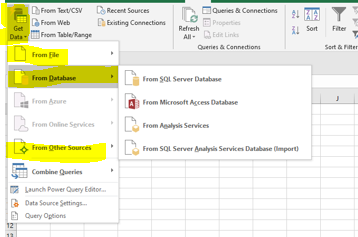
If you choose to get data from the web, you should give the appropriate URL to import data. If you choose a database, you should select the correct server and port and connect to the database.
For this example, we will create an excel sheet with a few lines of data so we can focus on understanding the excel features for data analysis.
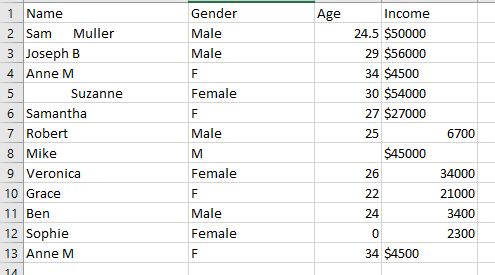
Note that this data has a lot of inconsistencies to better understand the example. Usually, the data that we have to analyze has millions of records with so many inconsistencies like missing values, incorrect values, inconsistent values, extra white spaces, duplicate values, and so forth.
2. Data Cleaning
Cleaning requires effort and time. Thanks to some in-built features of Excel, cleaning data is easier.
2.1 Removing Duplicates and Extra Spaces
In our data, rows 13 and 4 are the same, i.e., we have duplicate data. Go to the Data Tab, and select the Remove Duplicates option.
![]()
Click on the remove duplicates icon to do the needful:
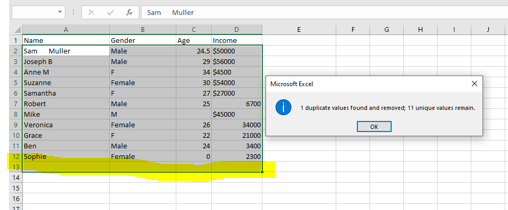
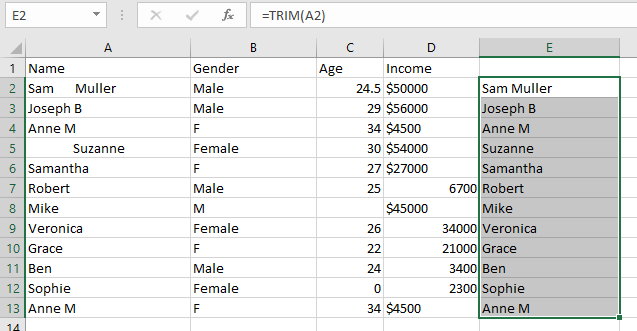
The last row (duplicate) has been removed. Excel also shows the count of unique and duplicate records. Excel also has a trim() function to trim any extra spaces. Simply give TRIM(A2) in the next free column, say column E. Drag the mouse to apply the same formulae to all the rows as shown below:
2.2 Splitting and Merging Columns
We can also split/merge columns using a delimiter. Suppose we want to take only the numeric part of the Income and not the ‘$’ symbol. For that, we can create a new column with only the values using the delimiter as $. Use the Text to Columns option for this.
![]()
After splitting, we get something like this:
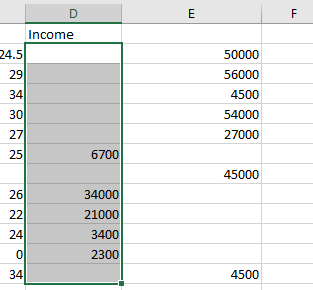
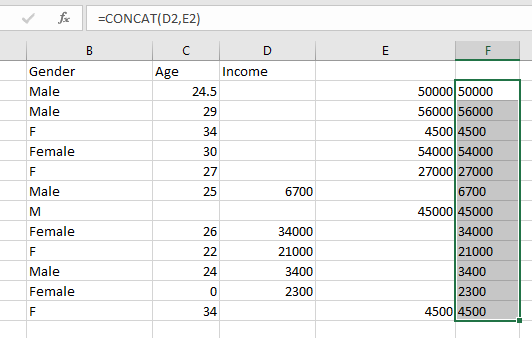
This is because some of the values did not have the ‘$’ symbol. So now, we need to merge these columns into one. We can do this using the CONCAT function by giving the columns to concatenate. This is also useful in joining two or more columns.
2.3 Filtering Data
There are still some inconsistencies in the data. Notice that the Gender column has four values, namely M, Male, F, and Female. M and Male are the same things as are F and Female. Thus, we need to create a single code. For this, we can sort and filter the data and then replace all the inconsistent values. Let's do it for F and Female.

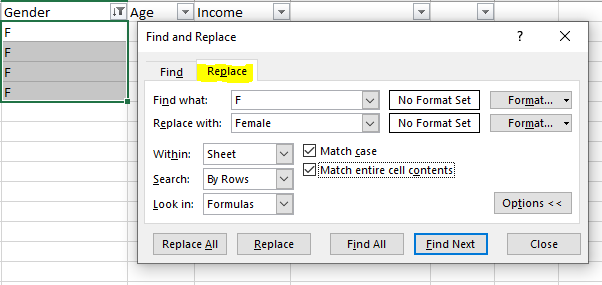
We can do the same for M and Male. Assume that we want to delete the rows where the salary is less than 5,000. We can sort and filter data accordingly.
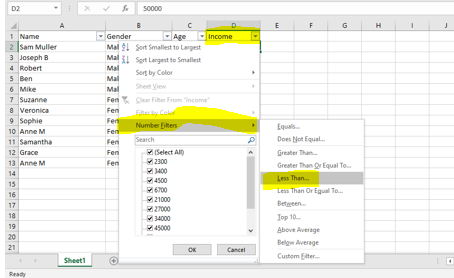
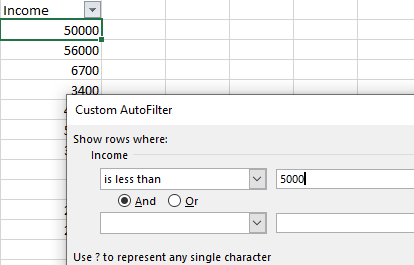

Select any row, right-click on it, and select the option ‘delete row.’
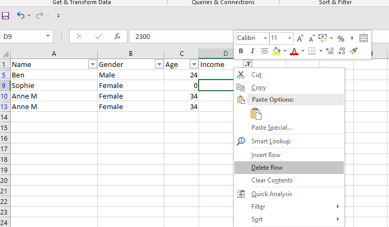
Excel will prompt you if you want to delete the entire row:
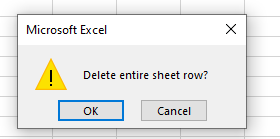
Click OK to delete the row, similarly for others. Once we clear the filter, we can see all the rows except the deleted ones.
2.4 Adding Missing Data
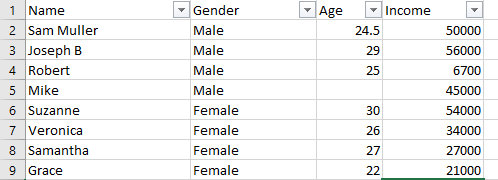
There is one last thing pending. A row with no age value. That’s missing data. We can either predict the value based on other similar data or remove this row altogether. We need to know if this data will contribute to further analysis.
Let us say it does. The closest salary to 45000 is 50000, which is for a person whose age is mentioned as 24.5. So, we can assume that Mike’s age could be the same,i.e., 24 or 25.
Also, from the general trends of the column, the dataset contains all ages that are between 20 to 30. So, we can safely fill the value as 25. There are many other features in Excel for cleaning and transforming complex datasets, which are beyond the scope of this article.
3. Data Exploration Using a Pivot Table
Once we have a clean dataset, we can explore it to get some initial insights. The most common data exploration tool in Excel is the pivot table. To create a Pivot table, go to the Insert tab, click on the Pivot table and select the range. We have selected all the columns except Name. Choose ‘New worksheet’ to generate the pivot table. You will get a sheet like this:
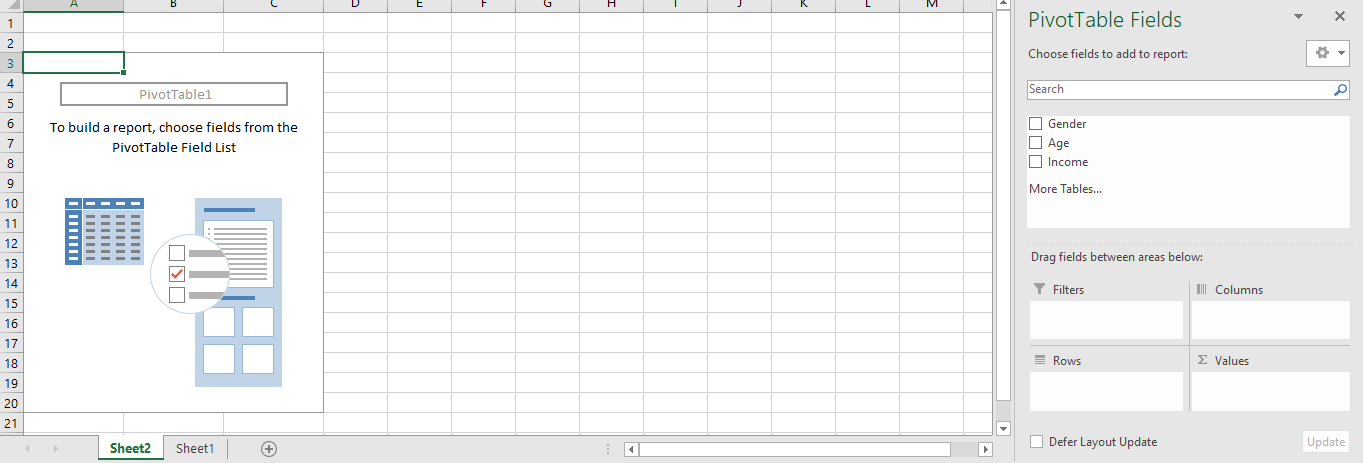 Select all the relevant fields, and you will be able to see all the basic statistics about your data.

4. Data Visualization Using Charts
Data visualization
will help us see what exactly we need to see in the data. Suppose we want to know the salary trend separately for males and females. Both Pivot tables and charts can be used for data visualization. To create charts, go to insert, and you will see a list of charts. Select any (let’s start with a box and whisker).
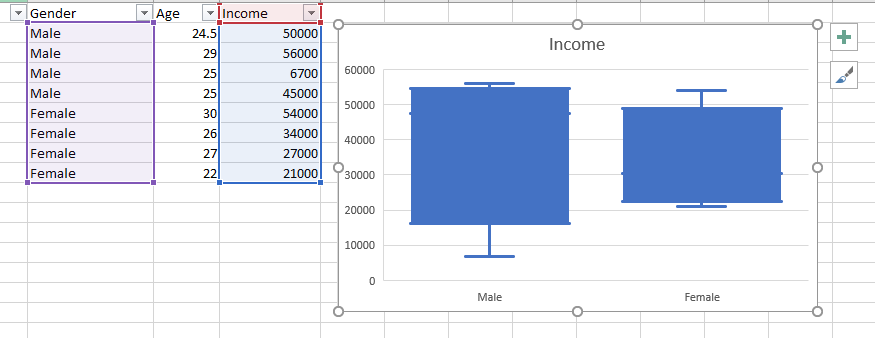
We can clearly see the outlier here: 6700. We can also create a Pivot chart with data from the Pivot table.
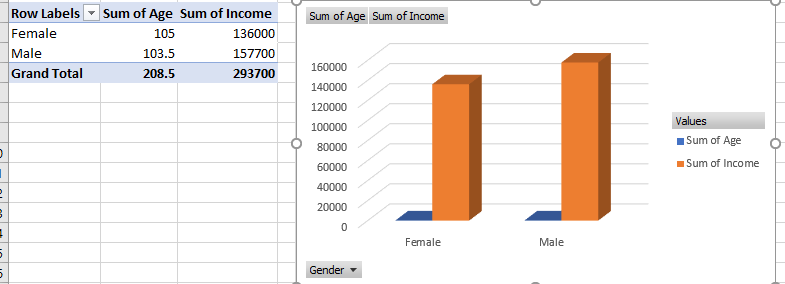
To create this, go to the Insert tab and then click on the Pivot chart.

There are many other features like forecast sheets and data analysis for which we need a lot of data. You can try downloading sample datasets from the web and work with them using Excel and try to find some insights about data.
Analyzing Data Using Python and R
Python and R are both equally effective for performing data analysis. Each language has its own set of features and rich libraries to perform data analysis. While Python has a readable and easy-to-understand syntax, R has RStudio that enables you to view graphics powerfully. To help you better understand how these two programming languages ease analyzing data, we have two great articles:
- Python for data science helps you understand how to perform data analysis using Python.
- R for data science illustrates how to leverage R libraries to perform complex analyses of data.
Summary
Analyzing data helps in solving various business problems and helps organizations boost their productivity. In this article, we learned that data analysis is a phase of the data science process in which data is cleaned, organized, analyzed, and visualized to get insights, trends, and patterns. Once these insights are consumed by the stakeholders, data scientists, and business analysts, they can make informed business decisions and improve their products and services.
People are also reading:
