
Machine learning is a process where machines can perform specific tasks without much intervention by humans. A machine can learn in various ways – it can be trained using a known data set where we feed the output to the machine, and it derives a general function from getting the output. The function can then be used on new unknown sets of data.
In the above example, the machine is fed inputs from external sources. Such a mechanism to train machines is called supervised learning . In a more complex real world, this is not always possible.
Machines have to learn by experience and produce an outcome that is better than the previous one until it reaches an acceptable accuracy level. This is called unsupervised learning . An even more dynamic form of machine learning is where an agent maximizes the cumulative reward by taking the necessary actions. This method, known as reinforcement learning , forms the basis for today’s gaming theory and robotics.
Simple day-to-day examples
Before we dive into the details of algorithms, let me give you a few simple examples of how we depend on machine learning, knowingly or unknowingly.
- Suppose you have loads of photos on Google and want to search for photos of a particular person. Google shows you an option, ‘People’, where the photos are sorted based on face recognition. Google also asks you whether person X is the same or different based on different photos of them taken at different angles. Based on this information, Google can improve its results every time.
- When you ask a particular question to Voice assistants like Alexa/Cortana/Siri, they can talk like a human to you. They can understand and process human speech, search the web for information you need, and present it to you in a human voice. This is possible through speech recognition.
- You want to watch a new series – and Netflix can recommend one! How? It can analyze your previous watching patterns or series/movies watched by other users with similar tastes as yours and then recommend what you potentially like. This gives you a personalized experience and saves browsing time!
- You open your email to find personalized marketing content based on browsing patterns. For example, if I search for a headphone on Flipkart, and close the browser, a little later, Flipkart can send me an email and offer discounts on the same and similar headphones!
- You want to play a chess game, but alas, no company! Well, no more worries, as the computer (machine) can play with you and dynamically place their moves based on your move. You can simply fiddle around to check the intelligence of the machine!
- During the COVID-19 pandemic, doctors were fully occupied with treating patients and handling emergencies. In such cases, chatbots could handle patients' queries based on their symptoms. These self-triage systems can advise a patient whether to call a doctor, visit the doctor, or remain in isolation.
These are only a few of the many machine learning examples. There are many more examples, and we can keep going on and on! But before that, can you recognize which type of learning the above examples fall under? Don’t worry, if you can’t answer this question right away, we will revisit this section after reading the article!
Types of Machine Learning Algorithms
As we have learned above, there are three main learning algorithms: supervised, unsupervised, and reinforcement.
1. Supervised learning algorithms
These are the algorithms in which the machine is fed with input-output pairs and finds a function f that satisfies the input-output pair. The function is derived using a labeled set of data. This is then used to analyze a new data set for which the output is unknown.
In supervised learning, a function f is mapped to the input X and output Y as Y = f(X). There are two approaches to finding the function f.
First is the empirical risk minimization, where the model determines the function f that tries to fit the training data best, minimizing the risk R.
Another approach is Structural risk minimization, where a penalty function is introduced that controls the bias-variance trade-off to find the best model. Once the desired accuracy is achieved, the model stops any further learning.
Supervised algorithms are of two types:
- Classification: These algorithms classify data into different categories based on a set of features. For example, sorting fruits based on color, text based on specific keywords, and emails based on their content – critical, spam, social, sports, etc.
- Regression: These algorithms forecast the relationship between a dependent variable based on independent variables. For example, obesity (dependent variable) depends on factors like overeating, lack of exercise, etc. (independent variables). Regression techniques are extensively used for sales forecast and time-series modeling – wherever we can fit the line or curve to get the least distance between the data points and the curve. The three main metrics for regression analysis are – the number of independent variables, the shape of the regression curve (linear, S-shape, etc.), and the type of dependent variable. For example, in our obesity example, there is a linear relationship between obesity and eating habits.
2. Unsupervised learning algorithms
In this type of learning, we don’t know the output and can’t label the data. The machine learns independently and identifies similar patterns and behavior to build a model.
Unsupervised learning is a bit more complicated and unpredictable than supervised learning because the machine selects the features independently. Real-time datasets usually don’t come with labels, making unsupervised learning methods more suitable and detailed.
The main unsupervised learning algorithms are Clustering, association rules, and Dimensionality reduction.
- Clustering: In this type, data is sorted into groups of clusters based on their similarities. The similarities can be in color, shape, size, etc. For example, people who like to order pizzas over weekends can be clustered together to send promotional emails over the weekend.
- Association rules: Association rules find patterns and links in data and build rules to create a model. For example, a person who buys bread would most likely buy milk, eggs, or butter; thus, those items can be shown together in a cart for users to add them easily.
- Dimensionality Reduction: If a dataset has many features, it becomes difficult to train the model. Thus, finding the essential features that can yield high accuracy is crucial. Thus, similar features can be eliminated as they would not give any helpful information, making the number of features less than in the original data set. This makes it easier to analyze the data and predict outcomes.
Read more about unsupervised learning .
3. Reinforcement learning algorithms
Reinforcement learning involves an agent taking actions in a specific environment, leading to maximum cumulative rewards. This type of learning is more a part of deep learning.
For example, making a child write the number ‘’8”. Since children have minimal time to focus, we have to continually remind the child of a reward that he/she will get upon performing their best. Once the child writes ‘8’, we reward her with new colored pencils. If they don’t finish, we take away her share of apple pie, and if she finishes fast, we give her the pencil set and chocolate.
Reinforcement learning can be positive or negative and has three approaches – value-based, model-based, and policy-based.
- Value-based: In a value-based method, the agent expects a long-term value or return.
- Model-based: Here, a virtual model is created for the environment, and the agent learns to perform in that particular
- Policy-based: In this approach, policies are formed in such a way as to maximize the rewards for every action in every state.
The decision-making in reinforcement learning is sequential, and no supervisors are involved. Time plays a pivotal role in the decision-making process.
Top Machine Learning Algorithms
Now that we have understood the different machine learning algorithms, we will further learn about a few specific algorithms of each type. There are hundreds of machine learning algorithms, but you will find the below most useful and easy to understand.
1. Naïve Bayes Classifier
It is a joint probability supervised (classification) algorithm. It is a highly scalable model where the maximum likelihood of an event can be calculated using a set of independent features. For example, how about determining the probability of a person purchasing a matching pair of earrings, knowing they purchased a necklace and a green-colored dress? The events that occurred (purchasing a necklace and green-colored dress) are independent events that can help determine the probability of buying earrings.
In general, P(A|B) = (P(B|A)*P(A))/P(B) where
P(A|B) = Posterior probability of event A occurring given B occurred
P(B|A) = probability that B occurs given that A occurred P(B) and P(A) = individual probabilities of occurrence of B and A
Some critical applications of the Naïve Bayes algorithm are in data mining like text processing, text classification, removing insignificant words from the text, finding keywords in an email, classifying email as spam, etc.
Naïve Bayes classifier can be of different types - Gaussian classifier, multinomial classifier, Bernoulli’s classifier. It is a fast method for classification and easy to train as it requires less data for training.
2. Support Vector Machine (SVM)
Each data item in this supervised learning algorithm is plotted in an n-dimensional space, where n represents the number of features. So, if we have three features, we will have three axes of coordinates.
Data points of different categories are then separated by drawing a hyper-plane (line, curve, circle, etc.). The hyper-plane is the best-fitting line that separates the categories. Determining the hyper-plane is the essence of SVM. If the hyper-plane is not linear, i.e., data cannot be separated linearly, SVM adds a feature that transforms the low-dimensional input plane into a higher-dimensional plane. This is called the kernel trick. Thus, SVM can be used for both linearly and nonlinearly separable data.
Did you already guess that it is a classification algorithm? Well, it can be used for regression too. The principles for SVR (Support Vector Regression) are the same but used for regression, i.e., finding a function that gives a real number for output instead of classifying objects. Some examples where SVM is used are face detection, image classification, handwriting detection, classification of genes, etc.
3. Decision Trees
These supervised learning algorithms predict response values based on specific decision rules derived from the features. Decision trees can be used for classification and regression. For example, we can predict what income range they would fit in based on a customer’s lifestyle choices, occupation, and spending preferences.
Decision trees can be categorized based on the type of target variable as a categorical variable decision tree or continuous variable decision tree. They use many algorithms for classification and regression, like ID3, CART, C4.5, and C5.0. Decision trees in machine learning are easy to understand and implement and are widely used in determining the best path to reach a goal, making strategic business decisions, etc. They are also used as ensembles in boosting or bagging, especially where there is unbalanced class distribution.
4. K-Means Clustering
K-means clustering is an unsupervised learning algorithm where data is divided into homogenous clusters (groups) based on similarities in their patterns. K-means aims to minimize the distance between the data points in the same cluster.
The number of clusters is decided at the beginning and denoted by the letter ‘K’. The optimal value of ‘K’ is determined using the ‘elbow’ method. Initially, k random points are selected from the data points as the centroids. Then all the nearest points are assigned to the closest centroid. Once all the points are assigned to clusters, we can revisit and recompute the clusters to get the new centroids. This process is iteratively done till we achieve the desired accuracy.
K-means is computationally fast and produces tighter clusters than other hierarchical clustering algorithms. Some applications of K-means clustering are in market research (analyzing which group of people prefer what kind of products and services), image processing, pattern recognition, data mining, and predictive analysis.
5. Linear regression
Linear regression helps determine the extent of the linear relationship of a dependent variable with one or more independent variables. It is one of the simplest forms of the supervised learning regression model and can be represented using the equation Y = a + bX where Y is the target (or outcome), X is the predictor (i.e., the input), and a is the y-intercept or the regression coefficient. B is the constant or the slope of the line.
A simple linear regression example is the relationship between a person's age and the risk of catching infections. As age increases, the risk of getting an infection becomes more.
Similarly, a person’s weight is directly proportional to their eating habits and forms a linear (straight) line. It is also possible for linear regression to have more than one explanatory variable to predict the outcome of a response variable. This type of regression is known as multiple regression or multiple linear regression (MLR). Some other forms of linear regression are general linear models, generalized linear models, heteroscedastic models, hierarchical linear models, etc.
Linear regression models are fitted or cross-checked for linearity using the least-squares method. Linear regression is used to forecast an effect, forecast trends, determine the strength of predictors, and analyze demand.
6. Logistic regression
Logistic regression is a statistical model that uses a logistic function (also known as the sigmoid function) to model binary variables, giving the outcomes as yes/no, true/false, pass/fail, and so on. There are only two possible values. In other words, it is a supervised learning method for predicting the probability of a categorical dependent variable, which is why it is listed under classification algorithms in some places. The dependent variable is binary, which can have two possible values, between 0 and 1. Logistic regression can be represented as p = 1/(1+e-(b0+b1x)).
The one question in everyone’s mind is that if the algorithm is based on classification, why do we call it logistic regression and logistic classification? That’s because it classifies the data only when combined with a decision rule. But it predicts probability value which is a continuous value ranging from 0 to 1. Since it has something to do with a continuous real value (and not category), it is called regression but used for classification.
Logistic regression is also a particular linear regression case where the outcome is a definite value. It can be used in medicine to detect and diagnose diseases and in predictive analysis for likelihood indication – for example, whether a person will buy a particular product, a student will pass his exams, etc.
Apriori
This is an unsupervised learning algorithm used for data mining, i.e., mining frequently purchased items and associated rules. The algorithm is applied to a database with massive transactions to find similarities in buying patterns. Through this algorithm, many companies could increase sales, offer effective discounts, and make customer purchases easy.
The example of bread-eggs, onion-potatoes, and beer-diaper has been used everywhere to illustrate the concept. The idea is that the bread customers will most likely buy eggs. Thus, these two items can be bundled together so buyers can easily pick them, similar to other combinations. The three essential components of this algorithm are –
- Support – the default popularity of an item. For example, if in 100 transactions, 80 included bread, the support = transactions involving bread/total transactions = 80/100 or 80%
- Confidence is the likelihood that customers who bought bread also bought eggs. Suppose, out of the 80 who bought bread, 60 bought eggs. So, confidence = transactions involving bread and eggs/total transactions = 60/100 or 60%
- Lift – it is the increase in the ratio of sales of bread when sold along with eggs as a bundle. Lift = Confidence (Eggs-bread)/Support(eggs). That is, the likelihood of buying bread and eggs together ‘ lift’ times more than purchasing eggs alone.
8. Mean Shift
Mean shift is a type of unsupervised clustering algorithm which is centroid-based. The candidates for centroids, i.e., the data points, are updated as the mean of the points within the given cluster or region. The duplicates are then removed to identify the final set of centroids.
Through iteration, this algorithm intends to locate a density function's mode (maximum) value. During each iteration, the data points keep shifting towards the highest density point, i.e., the cluster’s centroid.
Unlike K-means, this algorithm doesn’t need the number of clusters (k) to be specified. The algorithm detects the number of clusters on its own. Mean-shift algorithm is also called the mode-seeking algorithm and is used in several machine learning and deep learning applications like image processing and computer vision.
9. Principal Component Analysis
PCA is a dimensionality reduction algorithm where the essential features of a data set are selected to reduce the number of features, thus reducing the dataset's complexity and the model's training time. To do this, the features that are correlated (linearly, non-linearly) are eliminated as they don’t provide any extra helpful information. The correlation value can range from 0 to 1, with one being the maximum (but we can never get 1, except if the features are the same).
So, if feature A and feature B have a correlation value of 0.95, then they are highly correlated, and either A or B can be eliminated. You might think that if some features are eliminated, we might lose important information, but that’s not the case. With this algorithm, the features are reduced without losing any vital information. The final dataset is a set of orthogonal ‘principal components’ that are uncorrelated variables. PCA is widely used in image compression, computer vision, facial recognition, finding patterns in psychology, data mining, bioinformatics, etc.
10. Markov Decision Process
MDP is used in situations where the outcome of a problem is partly under the decision-makers control and partly random. The goal of MDP is to find a policy function (solution) that specifies the action that the decision-makers choose in a particular state ‘ s’ to maximize the cumulative (sum of) rewards. The process consists of 4-tuple –
- The set of states’ S
- Set of actions A; each state s from the state space S has a set of actions A s
- Probability P, which is the probability of the action a in a particular state s and discrete-time t leads to another state s 1 at another time t+1
- Reward R which is the immediate expected reward once the state is changed from s to s1
The reward can be positive (points) or negative (punishments), and the best rewards are received only towards the end. The reward in one state decides the probability of future states and rewards. MDP is a classic example of learning from interaction to achieve the desired goal. The decision-maker (agent) interacts continually with the states (environment), and the states respond to the actions and present new situations for the agent. MDP is widely used in modeling environments that are discrete, stochastic, and sequential. However, continuous-time MDP is also possible, where the decision can be made at any time the decision-maker decides, as opposed to discrete time intervals. MDP is extensively used in economics, queuing systems, manufacturing, automatic control systems, and robotics.
Bonus Machine learning algorithm
11. Q learning
Q learning is a reinforcement learning algorithm that finds an optimal policy function. This policy tells the decision-maker (agent) about the action to be taken under various situations. No model (of the environment) is required, and thus it is called a ‘model-free’ algorithm. The ‘q’ refers to the ‘quality’ of action taken by the agent, rather than the action itself, and is represented as Q(s, a) where a is the action and s is the state. In Q-learning, the agent knows exactly what reward it will get for each action. Therefore, the agent tries to perform the action that gives the maximum reward (obviously!).
The Q value depends on all the future states s1, s11…. up to sn. This can be represented as,
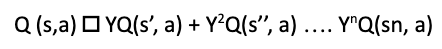
and can be calculated using the Bellman Equation . The value of Y decides whether the contribution of future rewards will increase or reduce. So, how is the value of Q determined? Initially, we assign random values for Q, which is repeated after receiving feedback. The values are then updated, and with the experience, we get the optimal value of Q. A simple example of Q learning will be a car parking game, where a car can be parked in many ways, but there is one best way, which gives maximum points. If a wrong path is followed, then you lose points.
Just like MDP, the sequence of events and time matters in Q learning because the agent must remember the current and future states and all the previous states. Some applications of Q learning are in self-driving cars, new recommendations, traffic signal control, etc.
How should I learn machine learning algorithms?
If you are a programmer and know at least one programming language like C++, Java, Python, or R, you can start with the basics of machine learning right away. If you don’t know any programming language yet, that’s the best thing – you are like a clean sheet of paper and can select any language you want to learn! (My two cents – Python is the most comfortable to learn, but if you have time, go for Java so that all the other languages will become easier to learn if the need is later on!) Once you choose the language, make sure you learn the following concepts thoroughly:
- Data structures like Arrays, LinkedList, Stack, queues, 2D arrays, sets, binary trees, hashtables, etc.
- Strings, Boolean, control statements (for, while, do, etc.), conditional statements (if-else if)
- Sorting algorithms like the bubble sort, merge sort, quick sort, selection sort, etc.
- Object-oriented programming, system design
- Writing lots of medium-complexity and straightforward code
With primary programming language, you can get started with machine learning algorithms. Most books also come with a crash course on programming languages. Also, you need to be familiar with library functions to be used while coding, which will come with practice, practice, and more practice!
Conclusion
This article introduces you to some standard and powerful machine learning algorithms and their applications. These algorithms will be covered in detail as separate articles, and giving more details like implementation or code is beyond the scope of this article. You could start with free online video tutorials and some excellent machine learning books if you wish to learn machine learning. With COVID-19 not ending anytime soon, machine learning algorithms are becoming all the more critical to predict the spread, identify patients with high risk, help patients with essential treatment through chatbots, and diagnose more patients in less time. All in all, machine learning jobs are one of the highest-paying jobs in the market now.
People are also reading:
- What is Machine Learning?
- Best Machine Learning Interview Questions
- Best Machine Learning Frameworks
- How to become a Machine Learning Engineer?
- Machine Learning Projects
- Classification in Machine Learning
- AI vs. ML vs. Deep Learning
- Machine Learning Applications
- Data Science vs. Machine Learning
- Decision Tree in Machine Learning